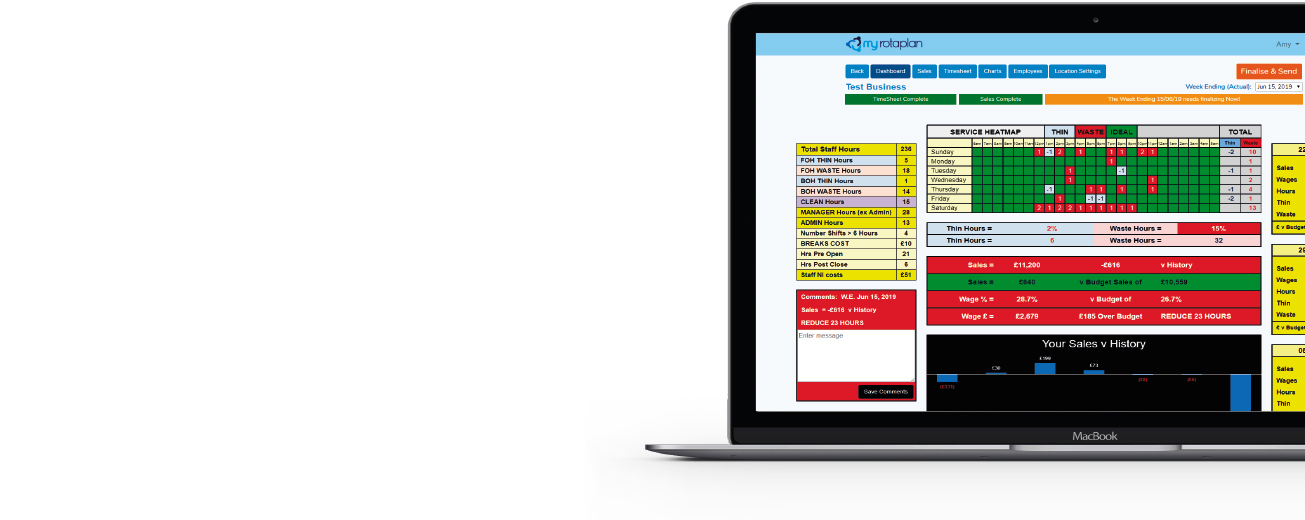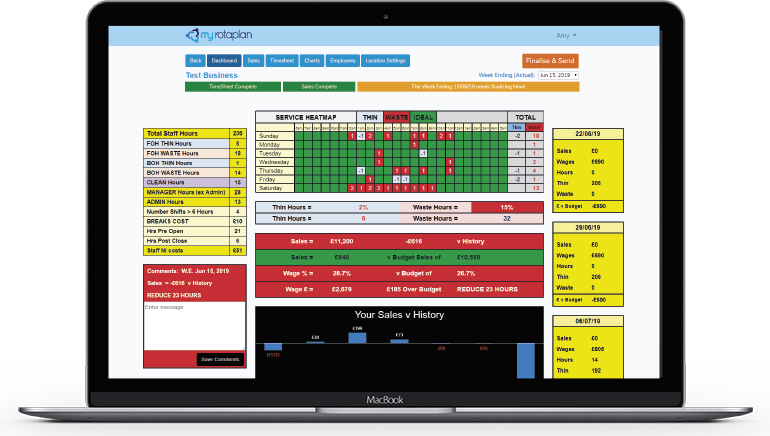


Here is where you view your overview of the week on one page and your summary forecasts.
- Your Service HeatMap is a great report pulling together a visual and numerical summary of your WASTE/THIN/IDEAL performance for each timeslot by day – prioritising where attention is required – see our section covering Service Heatmap
- Dashboard Data breaks down your rota and summarises your Sales forecast v History, Labour performance v Budget, Analysis of your WASTE & THIN hours and costs and Rota analysis of Hours used pre & post service, Shift and Breaks analysis and Management hours planned.
- A graphical overview of week Sales by Timeslot with Hours planned and IDEAL Hours and WASTE & THIN hours